There are plenty of website speed tests out there, some are better than others. Pingdom is one of these tools, this post explains how to fix some of the common issues it will highlight and how you can reduce your website load times.
Load the website above and enter your website homepage URL. You can also select where you want Pingdom to perform the test from. For the most accurate results pick somewhere other than where your website is hosted.
Reading the results
The first set of results outlines how the website performed overall. I've included a couple of example website results for comparison.
keithgreer.dev
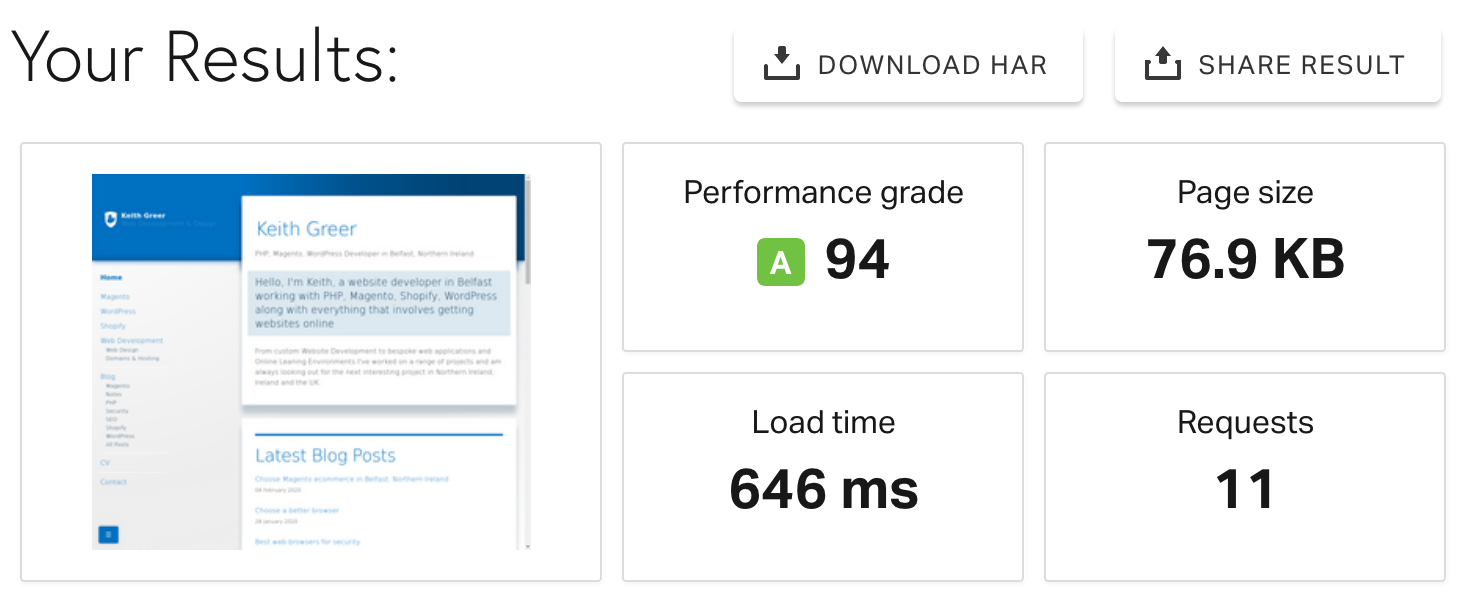
The first result shows a site that has been properly optimised for the web. The page load time was under 1 second and required 11 unique resources to load the page fully. All the resources totaled 76.9 KB which resulted in a performance score of 94%.
example.com
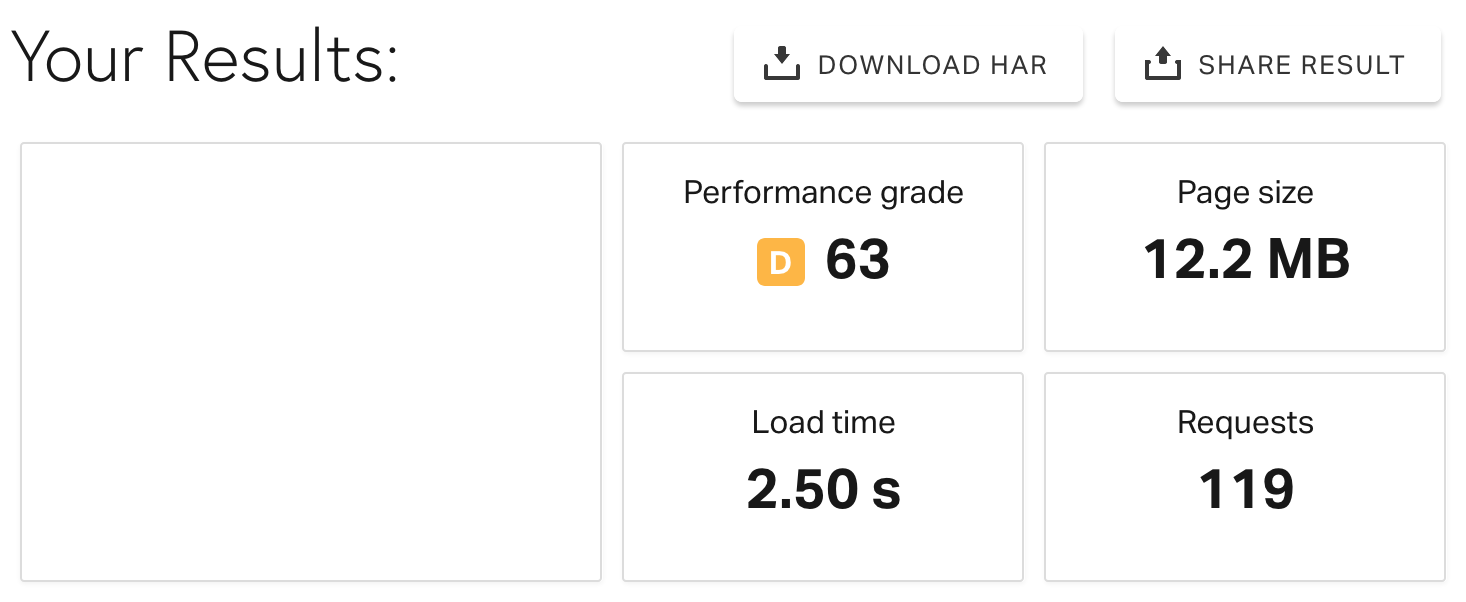
The screenshot above for example.com[1] shows the second website, which took slightly longer to load, but still under 3 seconds, the page required the browser to locate a total of 119 unique resources before the page was complete so a lot of the time taken the load the page was DNS lookups (finding the resource, rather than loading it). The site totaled 12.2 MB in size.
Improve page performance
-
Reduce DNS Lookups or Make fewer HTTP Requests: You should try and minimise the number of URLs and resources the browser has to query in order to load your page. For example, if you request 3 different CSS files from the same domain try and merge these into a single file.
-
Compress components with GZIP: Most web servers will have a setting which allows content to be delivered using GZIP if the browser requests it.
-
Use cookie free domains: If you are using a CDN or hosting resources on different domains, anything that serves static content should be cookie-free.
-
Add expires headers: You should tell the browser how often it should request a fresh copy of a file each time it is accessed. A first time visitor will need to download everything, but if they return the same day, week, month their browser may have saved a copy of an image, CSS, or JavaScript file that won't need to be looked-up again.
-
Avoid Redirects: 302 (temporary) redirects are often required if there is ongoing maintenance or a change is in progress. A 301 (permanent) redirect can be avoided by replacing the old URL with the new one.
Response Codes
Check the response code outputs. If the report is returning anything other than 2XX codes, check to see what you can do to reduce them.
Fix resources that return a 3XX response, these are being redirected and fixing them will reduce the number of HTTP requests the browser needs to make. Remove anything starting 4XX or 5XX, as they are not loading anything worthwhile.
- Keep 2XX. Any response code starting with a 2 means the requests was successful and the resource was found and loaded.
- Fix 3XX Response codes starting with a 3 are a redirect usually 301 for a resource that has moved permanently or a 302 for a resource that has been temporarily moved to another location.
- Remove 4XX A response starting with a 4 generally means the server couldn't find what you were looking for. The most common 404, means the file or resource couldn't be found, 401 means you don't have permission to access the file requested.
- Remove 5XX Response codes starting with a 5 means an issue with the server itself so the browser could't tell if the server understood the request for a specific file or resource.
1 not the actual example.com, but an anonymous website.
Latest posts
—
Core Web Vitals: Optimisation techniques
Google's Core Web Vitals have become the de facto standard for measuring user experience on the web. For years, developers have focused on the foundational trio: Largest Contentful Paint (LCP),…
Continue reading "Core Web Vitals: Optimisation techniques "
—
Web Safe Fonts: A Quick Explainer for Developers
If you've ever built a website and wondered why your carefully chosen typography looks completely different on someone else's screen, you've encountered the world of web safe fonts. Let's break…
Continue reading "Web Safe Fonts: A Quick Explainer for Developers "
—
Choosing the right content management system
Choosing the right content management system (CMS) is one of the most consequential early decisions when building a website The content management system shapes everything from how editors publish to…
Continue reading "Choosing the right content management system"
—
WYSIWYG or plain-text CMS editing?
Finding the Right Balance for Your CMS UsersWhen configuring a content‑management system (CMS), the choice between a WYSIWYG (What‑You‑See‑Is‑What‑You‑Get) editor and a plain‑text interface has far‑reaching implications for both usability…
